Posted by: Kenneth Graves | October 1, 2015

Initial Thoughts on the Strata + Hadoop Conference

I had the pleasure of attending with 6000+ other attendees the recent seventh annual Strata + Hadoop conference in NYC.  I found it both informative and interesting to see how the big data space is growing and evolving.  But as time is precious and I don’t want to bore anyone with my philosophical ruminations on the state of data analytics, here are my patented “Ken’s Five Key Takeaways” of the 2015 Strata + Hadoop World Conference:

  1. I could argue that Hadoop and the Big Data space—not synonyms, by the way—are at the Gartner hype peak. There were hundreds—okay, multiple dozens—of suppliers with slightly different approaches to the real challenges that enterprises face using Hadoop and family.  Certainly, those differences do matter, but as I wandered the booth aisles, I couldn’t help wondering how many of those companies would be back in three years after we have gone through the Gartner hype trough.  There are obviously still a lot of problems to be solved—and no one has perfected the “standard of care”.
  2. Here are the dominant vendor themes I found:
    1. We’ll Make it Easier! Lots of these black box approaches to analytics and big data. A lot of vendors there are dying to do it all for you with a push of a button.  “We’ll sit on top of all the stuff you really don’t want to see—and you probably can’t understand anyway. Trust us!”
    2. We’ll Make it Faster! Obviously there is a perceived need to speed everything up—from ingest to storage to analytics.
    3. We’ll Make it Secure! Making these massive data lakes that we are now creating secure has certainly caught the vendors and suppliers attention.  If the security is truly performant in the real world is, of course, another question.
  3. Money is still in the infrastructure not in the applications.  Comparing this to the excellent Data Science conferences such as AnalyticsBridge and Boston Open Data, there was a heck of a lot more cash being pushed around here.  It may be unfair to compare, but it’s my takeways and I can make unfair comparisons if I want to.  Anyway, when the martini bar opened on the expo floor and the line formed at the climbing tower, I wondered why Data Scientists couldn’t have this too!  We like to drink and climb dangerously high things.  Am I right or am I right?
  4. Somebody needs to switch the Apache Foundation’s coffee to decaf.  The seemly endless parade of projects that have been swirled into Hadoop ecosystem is truly something to behold.  Could we perhaps fix the software problems we have today without creating another service to install, maintain and complain about getting fixed?  My second thought on this is that the technologies we now are using are still too immature to say what the final grouping will be. There will always be a need for a variety of tools—but I don’t know if we have the correct insights into what that “mature” tool bag will contain. I have a feeling many of these projects we’re puzzling over today won’t be in it.
  5. Only one booth babe spotted.  On the other hand, there was a much better gender balance at the conference.  Instead of one in hundred being female, we are closer to 1 in 10 or 12.   I guess that’s progress for the Big Data industry.

PS: I was told by my colleagues that I missed the Star Wars Leia booth babe—but I can’t count her in my takeaways since I didn’t actually see her.  My takeaways are too sacred for that.

So I now know that suppliers believe that Hadoop/Big Data is hard, too slow and unsecure.  Stay tuned for further obvious findings.

Thanks for reading.

Posted by: Kenneth Graves | March 23, 2015

Data Science for All!

EVENTBRITE HEADER FINALFor those who, like me, are greatly interested in opening data science and analytics to a wider field, there is fantastic convention coming up: the Open Data Science Conference, May 30-31, 2015 at the Boston Convention Center.

Open source data science is revolutionizing the way we analyze information across multiple industries. The Open Data Science Conference will be the first event of its kind to bring together the open source and data science communities on this scale.  I highly recommend attending this unique event taking place right here in New England!

Some further interest points:

  • The purpose is the help the community learn, connect and grow.
  • Uniquely, this conference will also give back by directly funding open source initiatives in the data science community.
  • Accessible and inclusive conference
    • Conferences on the weekends
    • Low ticket prices relative to similar conferences
  • Neither a vendor parade nor an academic conference, it is use-case driven
  • The conference is around the languages, tools, and topics of open data science
  • Encompasses open data, open source, big data, and data science

Open source data science is revolutionizing the way we analyze information.  Why not tap into the latest innovations and opportunities?

Why people should attend:

  1. Learn the languages, tools, and topics that are relevant to today
  2. Hear from some of the greatest minds in data science
  3. Connect with potential employers and partners
  4. Meet other fellow data enthusiasts
  5. Held at a convenient time outside of work-hours

In the coming weeks, I’ll preview some of the great speakers and events in this convention.  Don’t miss out!

Data science for all #ODSc @OpenDataSciCon  http://opendatascicon.com/

Things I’m Watching This Week

Wednesday, as expected, the Fed Open Market Committee left their target rate at .25%, but removed the word “patience”  from their notes.  This was anticipated and so far the markets have responded positively, with the VIX trading around 13 with April’s Futures around 15.  Everything points to a very interesting summer!

  • Tuesday, March 24th: US Feb CPI should show around zero YoY growth–thanks to plummeting energy prices.  Excluding energy and food, I’m forecasting around 1.7% growth.
  • Wednesday, March 25th: US Durable Good Orders for Feb.  I’m forecasting minimal growth.
  • Thursday, March 26: Sweet 16–okay, my analyzed bracket is as busted as anyone’s so I won’t bore you with the details, but I’m still in my family bracket race thanks to everyone else being as bad or worse.

Thanks for reading!

Posted by: Kenneth Graves | March 16, 2015

March Madness 2015

Yes, it is that time again to choose your brackets for the NCAA tournament.  I’ve created a new model for this year–we’ll see how I do.  If I’m brave enough, I might even publish some of my predictions!

What I’m Watching This Week

Last week saw both February advanced retail sales and U of Michigan’s Confidence value decline unexpectedly (-0.6% and 91.2).  This has may certainly have added to the market’s volatility in recent days.  The VIX is currently trading in the 15.5 range, with an April future trading around 17.3.  Doesn’t sound like the markets are too worried right now.  Fairly light economic news this week:

  • Tuesday, March 17th: St. Patrick’s Day!
  • Wednesday, March 18th: Fed Open Market Committee rate decision and following press conference.  I’m not expecting any rate change (obviously), but we should hear some language modification about when the rate change might occur.  I’m sure the tea leaf readers will have much joy.
Posted by: Kenneth Graves | March 1, 2015

March Comes Marching In…

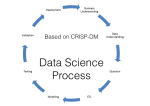
update-20150206.001When beginning a new data analysis project the easiest course always seems to be the immediate jump into the data and problem solving path.  It feels heroic and looks great in front of your hopeful client.  “Look!  He’s already doing his wizardry!  Won’t be long till all my issues are solved!,” says the client, only to be disappointed later as the analyst unveils a litany of p-values, statistical conundrums and actionless trivia.  The delivered data analytic product is light on value and detached from what the client really wanted–solutions.

I’m not claiming that I never fall victim to this “easy” road trap, but I always try to keep it in mind as I start new projects, which I have been doing in the last few weeks.  I created the image at the start of this entry to clarify the often confusing steps when approaching data science.  For us worker bees outside of academia, understanding the client’s business context and needs must be the first step, the touchstone of everything that follows.  It doesn’t guarantee that you will have a perfect outcome, but if you clarify from the beginning what the business goals and questions are, you will at very least be working towards a common goal with your client.  And always remember–

Data is not information,
Information is not knowledge,
And knowledge is definitely not wisdom.

Data analysis can often be very interesting–making it very useful is even better!  Here ends the lesson.

BTW, March is here–where did February go?

What I’m Watching this Week

So we had some up and down information last week involving GDP and CPI, markets appear to believe the inevitable interest rate rises will begin towards the end of summer rather than the beginning, and the NASDAQ teases with new heights.  This week should provide some interesting economic data.

  • Monday, March 2nd: ISM Manufacturing data for February.  Forecasting to stay even around 53.0.
  • Tuesday, March 3rd: Yes, Spring Training Games actually begin!  As I freeze in the Northeast, it is soul-nourishing to see grown men play baseball on green fields.
  • Wednesday, March 4th: US Fed releases its Beige Book.  I’ve got to get my text mining scripts ready.
  • Friday, March 6th: Unemployment rate figures for February.  I’m very interested in what the weather in the East is going to do here–and if the markets even notice.
Posted by: Kenneth Graves | February 27, 2015

The View 1/6 into 2015

It’s been a while since I updated my blog thanks to a VERY busy January and February.  So I thought I might jot down a few interesting “thoughtlets”:

  • Soshag.com, my latest startup adventure, is soooo close to public beta.  Very big surprises coming our way. In some ways, it has far surpassed my expectations.  But what a long journey.
  • Doing a lot of work recently with Google Analytics and the RGoogleAnalytics package in R.  Very fun and powerful!  Hopefully, I’ll do a blog entry soon on some of the aspects.
  • Also doing a mini datamining project in Octave/Matlab.  Switching back forth between R and Octave is like making a huge gear shift on a ten-speed bike: disorienting to the legs/brain and apt to make you look foolish.
  • GDP (revision) came in line with expectations today at 2.2% annualized.  Personal Consumption came in a little lower than expectations at 4.2% (versus expected 4.3%).  I’m not expecting much to happen in markets.  There are some many other macro-political factors driving this market right now.
  • Is there a better time to be a Data Scientist/Quant/Analytics Engineer?  I swear it gets more fun every day!

Thanks for reading!

Posted by: Kenneth Graves | December 4, 2014

Fun with SIR

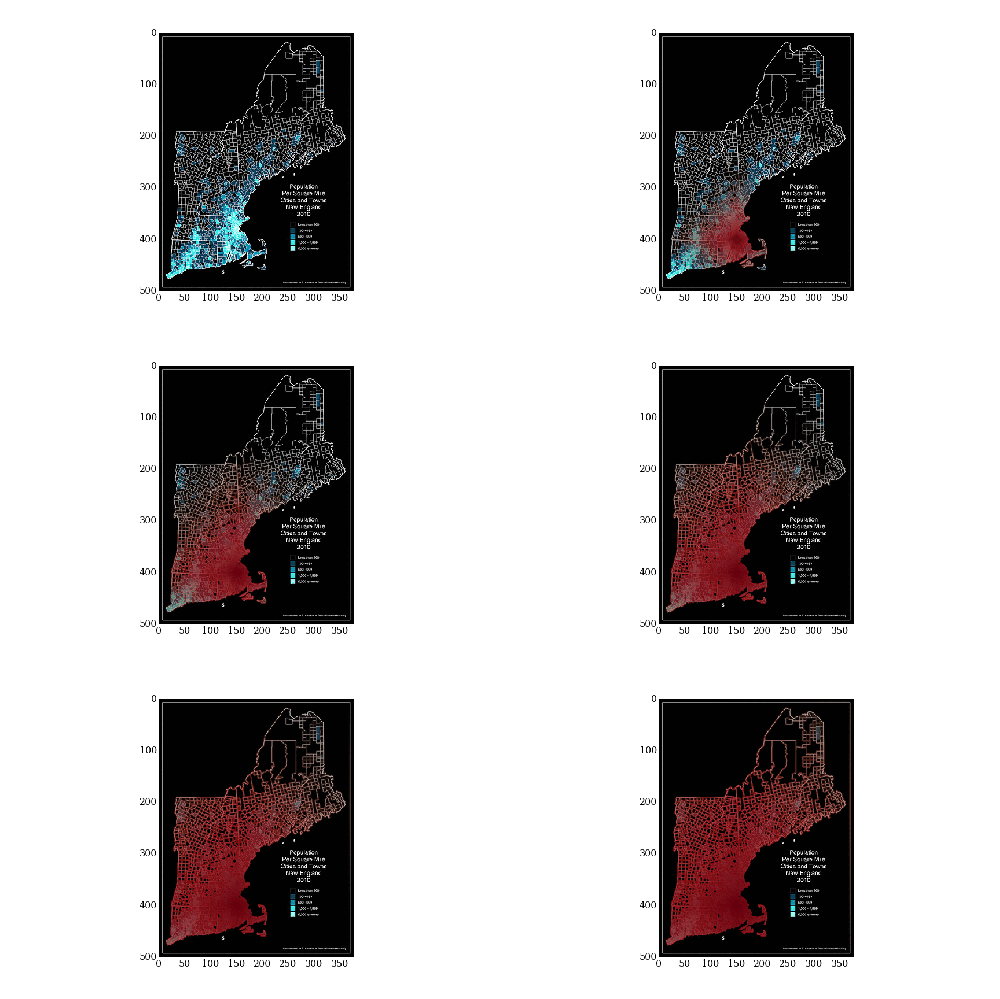
The holidays et al. took quite a toll on my blogging cycles.  But I recently stumbled on some really cool python modeling of disease spread–or zombie apocalypse.  Max Berggren‘s very nice description and example of the SIR epidemiological model–S for susceptible, I for moving infected and R for removed, one way or another.  Max modeled a zombie plague in Scandinavia based on population and virulence.

With our own possible ebola case at MGH I decided to tweak Max’s code for New England–it’s practically Scandinavia to this transplanted California, anyway.  Very nice python programming using the Euler Method.

So here’s what a VERY virulent epidemic (or zombie attack) would look like:

animated

Here’s the code:

# -*- coding: utf-8 -*-
"""
Created on Thu Dec  4 14:47:22 2014

@author: Kenneth Graves
"""

import numpy as np
import math
import matplotlib.pyplot as plt    
from matplotlib import rcParams
import matplotlib.image as mpimg
rcParams['font.family'] = 'serif'
rcParams['font.size'] = 16
rcParams['figure.figsize'] = 12, 8
from PIL import Image
import matplotlib.cm as cm

beta = 0.01
gamma = 1

def euler_step(u, f, dt):
    return u + dt * f(u)

def f(u):
    S = u[0]
    I = u[1]
    R = u[2]
    
    new = np.array([-beta * (S[1:-1, 1:-1] * I[1:-1, 1:-1] + \
                            S[0:-2, 1:-1] * I[0:-2, 1:-1] + \
                            S[2:, 1:-1] * I[2:, 1:-1] + \
                            S[1:-1, 0:-2] * I[1:-1, 0:-2] + \
                            S[1:-1, 2:] * I[1:-1, 2:]),
                     beta * (S[1:-1, 1:-1] * I[1:-1, 1:-1] + \
                            S[0:-2, 1:-1] * I[0:-2, 1:-1] + \
                            S[2:, 1:-1] * I[2:, 1:-1] + \
                            S[1:-1, 0:-2] * I[1:-1, 0:-2] + \
                            S[1:-1, 2:] * I[1:-1, 2:]) - gamma * I[1:-1, 1:-1],
                     gamma * I[1:-1, 1:-1]
                    ])
    padding = np.zeros_like(u)
    padding[:,1:-1,1:-1] = new
    padding[0][padding[0] < 0] = 0
    padding[0][padding[0] > 255] = 255
    padding[1][padding[1] < 0] = 0
    padding[1][padding[1] > 255] = 255
    padding[2][padding[2] < 0] = 0
    padding[2][padding[2] > 255] = 255
    
    return padding
    
img = Image.open('popden_ne.jpg')
img = 255 - np.asarray(img)
imgplot = plt.imshow(img)
imgplot.set_interpolation('nearest')

S_0 = img[:,:,1]
I_0 = np.zeros_like(S_0)
I_0[400,150] = 1

R_0 = np.zeros_like(S_0)

T = 900
dt = 1
N = int(T/dt) + 1
t = np.linspace(0.0, T, N)

u = np.empty((N, 3, S_0.shape[0], S_0.shape[1]))
u[0][0] = S_0
u[0][1] = I_0
u[0][2] = R_0

theCM = cm.get_cmap("Reds")
theCM._init()
alphas = np.abs(np.linspace(0, 1, theCM.N))
theCM._lut[:-3,-1] = alphas

for n in range(N-1):
    u[n+1] = euler_step(u[n], f, dt)

from images2gif import writeGif

keyFrames = []
frames = 60.0

for i in range(0, N-1, int(N/frames)):
    imgplot = plt.imshow(img, vmin=0, vmax=255)
    imgplot.set_interpolation("nearest")
    imgplot = plt.imshow(u[i][1], vmin=0, cmap=theCM)
    imgplot.set_interpolation("nearest")
    filename = "outbreak" + str(i) + ".png"
    plt.savefig(filename)
    keyFrames.append(filename)
  
images = [Image.open(fn) for fn in keyFrames]
gifFilename = "outbreak.gif"
writeGif(gifFilename, images, duration=0.3)
plt.clf()

One note is my image2gif python package was not working–so I manually composed it with ImageMagik.

Thanks for reading!

Posted by: Kenneth Graves | November 17, 2014

Weekly Update

Busy week–as I image a lot of you are having, so I’ll just give a glimpse into what I’m watching this week.

What I’m Watching This Week

Wednesday, November 19th: Fed releases its October minutes.  Should be good for my machine learning language project.  Looking for insights into changing attitudes between the dove and the hawks on the Fed.

Thursday, November 20th: Consumer price index for October.  Right now forecasting a 1.6% rate for the headline, 1.7% excluding food and energy.  Could be in for a surprise on this with dropping crude prices.

Thanks for reading…

Posted by: Kenneth Graves | November 10, 2014

Data, Data Everywhere…

Last week turned out to be the season of analytics with not one, but two fantastic Boston events involving data science.  The week started with a series of evening presentations at the Boston Data Festival.  Then on Thursday and Friday, AnalyticsStreet covered a bewildering array of speakers and workshops.  The quality of both speakers and content was absolutely superb, covering topics as diverse as fundamental science to the cutting edge of Hadoop vendors.  I certainly couldn’t do justice to all the wonderful events, but I do want to highlight a few that I especially enjoyed:

  • On Tuesday evening, Thomas Wiecki gave a great presentation on using Bayesian approach to evaluate quantitative trading algorithms. (slides)
  • On Wednesday evening, Lynn Cherny gave a great talk on network visualization.  She also introduced me to Gephi which I’m immediately putting to use. (slides)
  • Thursday afternoon, Andrew Carlson of PWC, gave a very interesting presentation on “Appyfying Analytics”.
  • Thursday evening, Eric Morris, gave one of the most succinct and enlightening presentations on using neural networks for financial modeling I have ever encountered. (slides coming, I hope)
  • Friday morning’s keynote speaker, Dr. Michael Brody, gave a great lecture on the need for maintaining the fundamentals of science as we do our analysis.  A great reminder that science is at the heart of “data science”, not just data.
  • Saturday morning, I ended my feast of data science with a great walk through with Professor Allen Downey on doing Bayesian analysis with Python. Yes, you can do Bayesian analytics at 8:00 AM on a Saturday morning.(slides)

I do hope that AnalyticsWeek puts the slides up for their speakers.  It would be well worth reviewing if you are at all interested in Big Data or data analytics.   In the meantime…

Things I’m Watching This Week

I’ll start with what I wished I didn’t watch–which was the Bears-Packers game Sunday night.  Wow!  I mean, wow!  Tweets about the possibility of the NFL flexing out of the game broadcast during half-time were amusing.

Last week brought good ISM manufacturing and unemployment numbers.  Lets see if we can keep the good news coming:

Friday, November 14th: We’ll get advanced retail sales for October and U of MIchigan’s confidence survey.  I’m looking for both to be slightly higher.

Thanks for reading.

Posted by: Kenneth Graves | October 27, 2014

Recommendation Portfolio Revisited

Just when you thought it was safe to go back into the water…

As you might know, I have been revisiting a virtual portfolio of 20 of my “long” positions that I have recommended since 2010 to October 1st, 2014.  This proxy portfolio has an expected monthly return of 1.56% with a monthly standard deviation of 2.7%, and a sharp ratio of 0.5704.  In previous entries I have looked at the overall spread of returns of the individual positions and the performance of an equal weighted portfolio.  Today, using R, I want delve a little deeper with portfolio theory and a more optimized weighting.

Assuming a Constant Expected Return (CER) model and some very basic Markowitz portfolio theory, I want to look at three related areas: a global minimum variance portfolio (GMV), an efficiency frontier of possible portfolios, and finally a tangency portfolio.  The benefit of CER model with Markowitz portfolio theory is that the only parameters needed are expected return and expected variance (and covariance). I will initially be using short sales as they make the math easier, but it does go against the spirit of a recommendation portfolio.  I like to thank Eric Zivot for providing some helpful portfolio scripts that I was able to integrate into my analysis.

Read More…

Posted by: Kenneth Graves | October 20, 2014

God, King and Country

In honor of Virgil’s 2,084th birthday last week, I decided to practice a little word analysis on the Aeneid–or at least a translation of that work.  I used Tufts unbelievably wonderful Perseus Digital Library–one of the truly great resources on the web.  I chose Theodore C. William’s translation.  I could have used Dryden’s verse version but was a little short on seventeenth century stopwords!

As you can imagine, the Aeneid was about a lot of things, but mostly it centered on what it takes to become a man–and the sacrifices that are made along the way.  At the center of the wordcloud is heart, hand, god and king.  A very fitting description of the great epic’s many themes.  Below that you can find the script that I used to create it.

Aeneid Wordcloud

# virgil.R: Script to do word analysis on Virgil's Aeneid.
# Written by: Kenneth D. Graves.
# Date: 19 October 2014
 
# Load necessary libraries
library("XML")
library("tm")
library("SnowballC")
library("RColorBrewer")
library("wordcloud")
 
# Chose your version.  Current script is set up to study Theodore C. William's version
# Aeneid Version: Theodore C. Williams. (English)
file_url <- "http://www.perseus.tufts.edu/hopper/dltext?doc=Perseus%3Atext%3A1999.02.0054"
 
# Aeneid Version: J. B. Greenough. (Latin)
#file_url <- "http://www.perseus.tufts.edu/hopper/dltext?doc=Perseus%3Atext%3A1999.02.0055""
 
# Read in the correct version from Tuft's Perseus site.  Read the xml and 
# transform it into a corpus for further analysis.  Lower case the word corpus
# and "stem it" to find the base words.
doc <- xmlTreeParse(file_url, useInternal = TRUE)
rootNode <- xmlRoot(doc)
body_tex <- xmlSApply(rootNode[[2]],xmlValue)
aeneid_corpus <- Corpus(VectorSource(body_tex))
aeneid_corpus <- tm_map(aeneid_corpus, content_transformer(tolower))
aeneid_corpus <- tm_map(aeneid_corpus, stemDocument)
 
# Remove "stop" words and create a Term Document matrix.
stnd_stopwords <- stopwords("SMART")
aeneid_stopwords <- c(stnd_stopwords,"aeneas","trojans","turnus","latins","italy",
                      "latinus","trojan","venus","latinus","jove","thi","oer","thou",
                      "thee","oer","aenea","mani","citi","everi")
aeneid_tf <- list(weighting = weightTf,
                  stopwords = aeneid_stopwords,
                  removePunctuation = TRUE,
                  tolower = TRUE,
                  minWordLength = 4,
                  removeNumbers = TRUE)
aeneid_tdm <- TermDocumentMatrix(aeneid_corpus, control = aeneid_tf)
 
# Remove the sparse terms from the matrix, chose .95 as the maximal allowed sparsity.
aeneid_95 <- removeSparseTerms(aeneid_tdm, .95)
aeneid_rsums <- sort(rowSums(as.matrix(aeneid_95)), decreasing = TRUE)
aeneid_df_rsums <- data.frame(word=names(aeneid_rsums), freq=aeneid_rsums)
aeneid_df_rsums <- aeneid_df_rsums[-1,] # Weird word that stopwords didn't catch: "oer".
 
# Make a nice wordcloud png of it.
palette <- brewer.pal(9,"BuGn")
palette <- palette[-(1:2)]
png(filename = "./virgil.png")
aeneid_wordcloud <- wordcloud(aeneid_df_rsums$word, aeneid_df_rsums$freq,
                              scale = c(7,.2),
                              min.freq = 4,
                              max.words = 200,
                              random.order = FALSE,
                              colors = palette)
dev.off()

Created by Pretty R at inside-R.org

Things I’m Watching This Week

Last week’s volatility was more than enough to keep me interested.  Advanced retail sales report suffered a little more than forecasted–down -0.3% from my even prediction.  U of Michigan’s Confidence index did much better than expected running to 86.4, from the forecasted 84.0.

Tuesday, October 21st: QWAFAFEW meeting, Model Risk Management: Using an infinitely scalable stress testing platform for effective model verification and validation.  Looks to be a very interesting discussion led by Sri Krishnamurthy, CFA, CAP.  Go here for more information, and then just GO TO THE MEET!

Wednesday, October 22nd: Consumer price index for September.  Forecasted for 1.6%

Thanks for reading!

Older Posts »

Categories